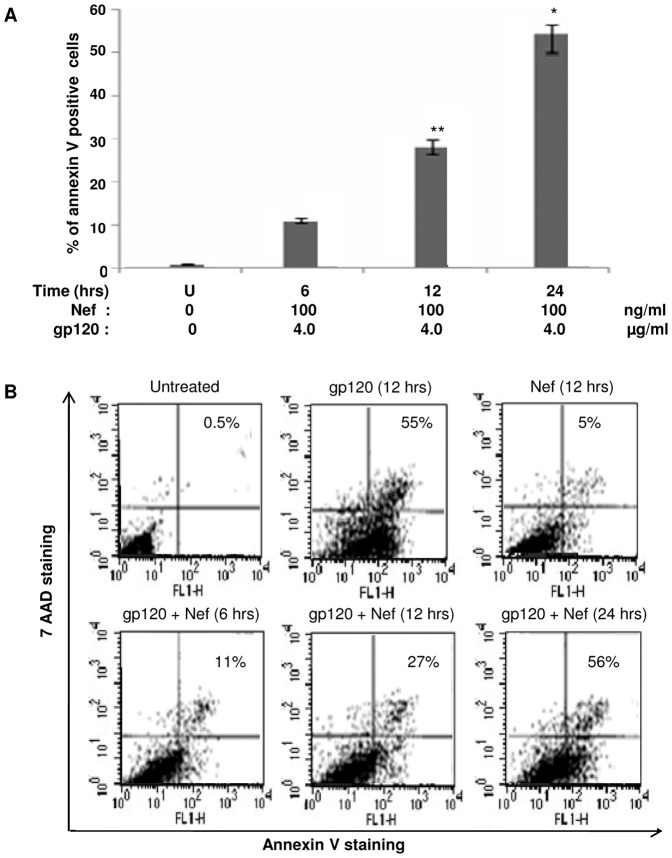
Figure 14. Relative measurement of the rate of apoptosis in immDCs upon subjecting them to treatment with Nef and gp120.
(A) ELISA analysis of the apoptosis rate in immDCs upon subjecting them to treatment with Nef and gp120 in individual sets of experiments. The dosage of Nef and gp120 were 100 ng/ml and 4 µg/ml respectively. X-axis denotes the combined dosage of Nef and gp120. Y-axis represents the percentage of annexin positive cells. Data represent the mean±SEM (n = 3). Statistical analysis was performed using Student's t-test, with the levels of significance defined as p*<0.05 and p**<0.01. (B) FACS analysis of apoptotic immDCs cells on treating with gp120, Nef and combination of gp120 and Nef in a time dependent manner. The percentage denoted on the right side of each histogram denotes the positively stained cells.

