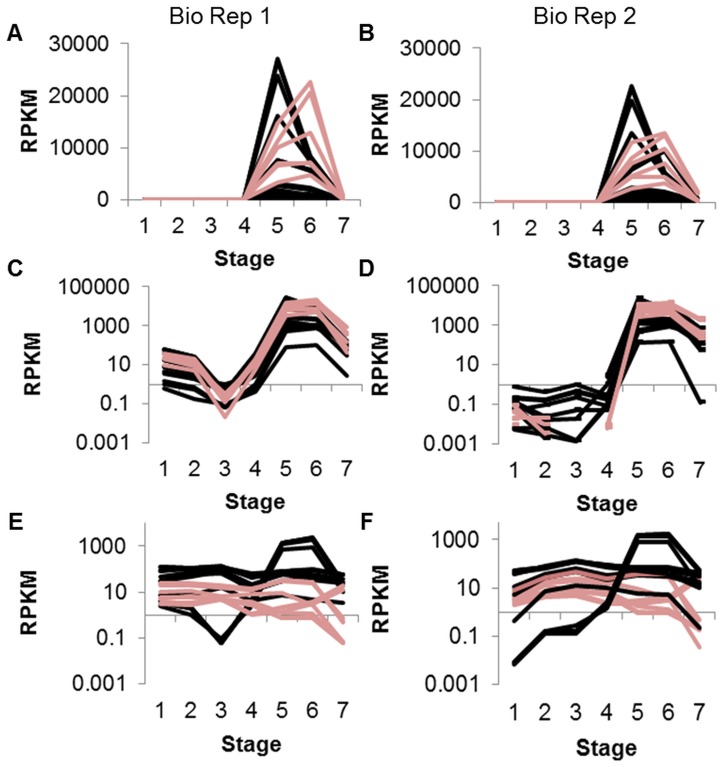
Figure 2. Storage protein gene models grouped by annotation.
Annotations were derived from PFAM and/or the NCBI non-redundant database. Clusters were created from Biological Replicate 1 data (A, C, E) and the same gene models were also graphed with Biological Replicate 2 data (B, D, F). A shows glycinin (pink) and beta-conglycinin (black) storage proteins with RPKM≥5 in at least one of seven stages; C is the same graph using log scale. (An RPKM of 0 will not display on a log scale and may appear as a break in the line.) E shows omega-3-fatty acid desaturase (pink) and omega-6-fatty acid desaturase (black) with RPKM≥5 in at least one of seven stages, log scale. Stages are numbered in order on the x axis: 4 DAF whole seed, 12–14 DAF whole seed, 22–24 DAF whole seed, 5–6 mg whole seed, 100–200 mg cotyledon, 400–500 mg cotyledon, dry whole seed.

