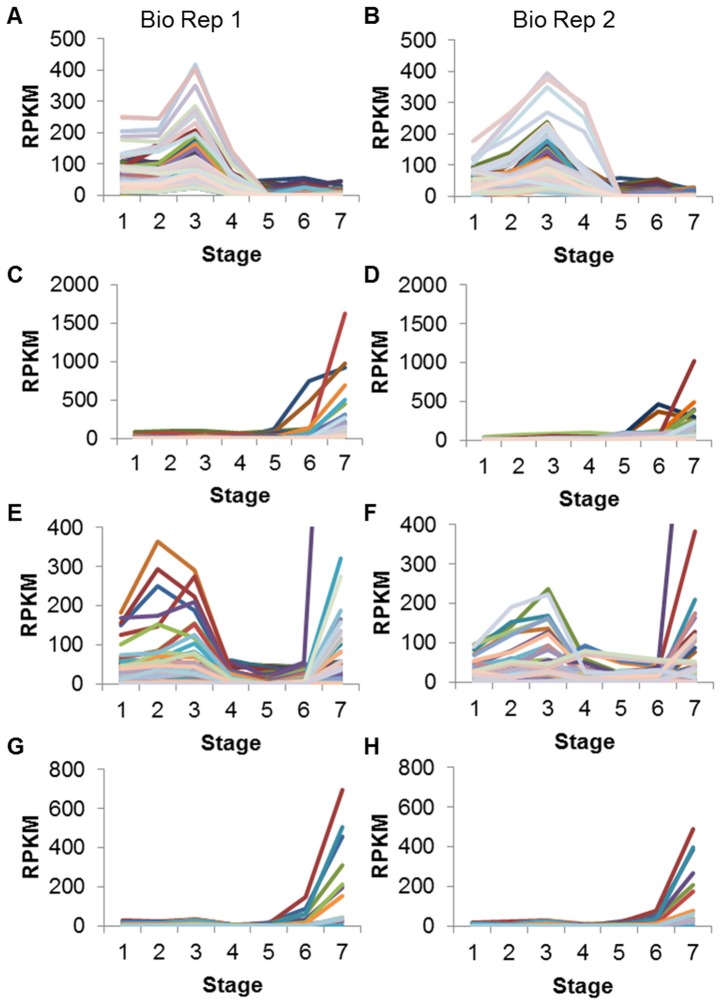
Figure 4. Transcription factor gene models.
Clusters were created from Biological Replicate 1 data (A, C, E, G) and the same gene models were also graphed with Biological Replicate 2 data (B, D, F, H). A and C display transcription factors with RPKM≥25 in at least one of seven stages of seed development. E displays gene models annotated as AP2/ERF/EREBP (ethylene responsive) transcription factors with RPKM≥25 in at least one stage of seed development. The Y axis has been set at 400, cutting off the purple line on the right, which reaches an RPKM of over 1400 at the dry seed stage. G displays gene models annotated as No Apical Meristem (NAM/NAC) transcription factors with RPKM≥25 in at least one stage of seed development. Annotations were derived from PFAM and/or the NCBI non-redundant database. Stages are numbered in order on the x axis: 4 DAF whole seed, 12–14 DAF whole seed, 22–24 DAF whole seed, 5–6 mg whole seed, 100–200 mg cotyledon, 400–500 mg cotyledon, dry whole seed.

