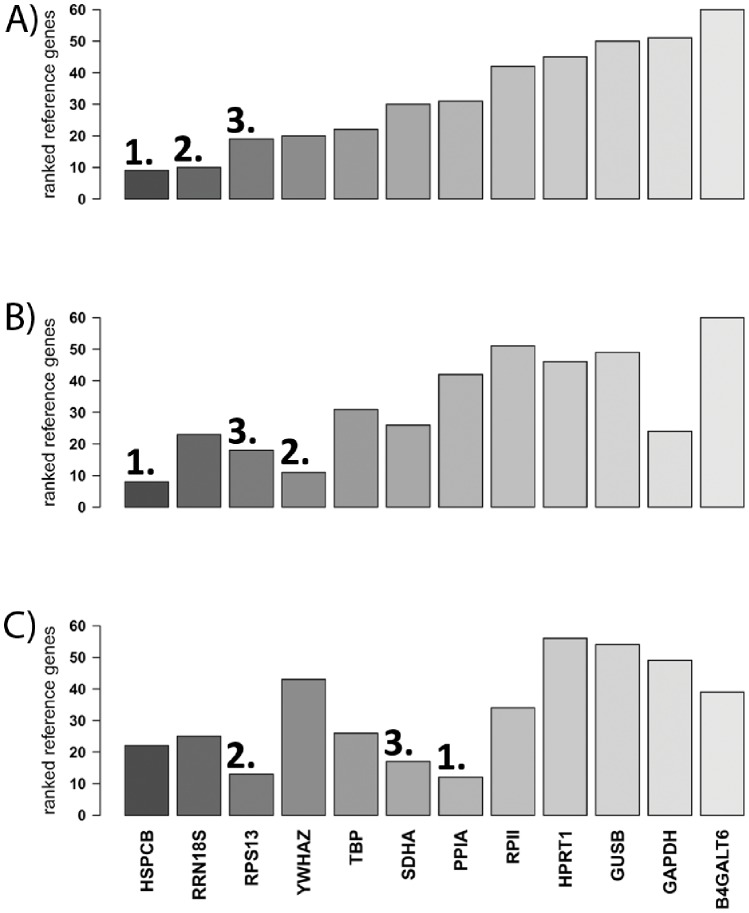
Figure 3. Bar graphs showing the most stably expressed genes calculated by rank sum of the 5 algorithms applied.
(A) All investigated cell lines (n = 25), (B) colon cancer cell lines (n = 9), and (C) normal and ovarian cancer cell lines (n = 11). Numbers highlight the first three most stable reference genes in each experimental set up.

