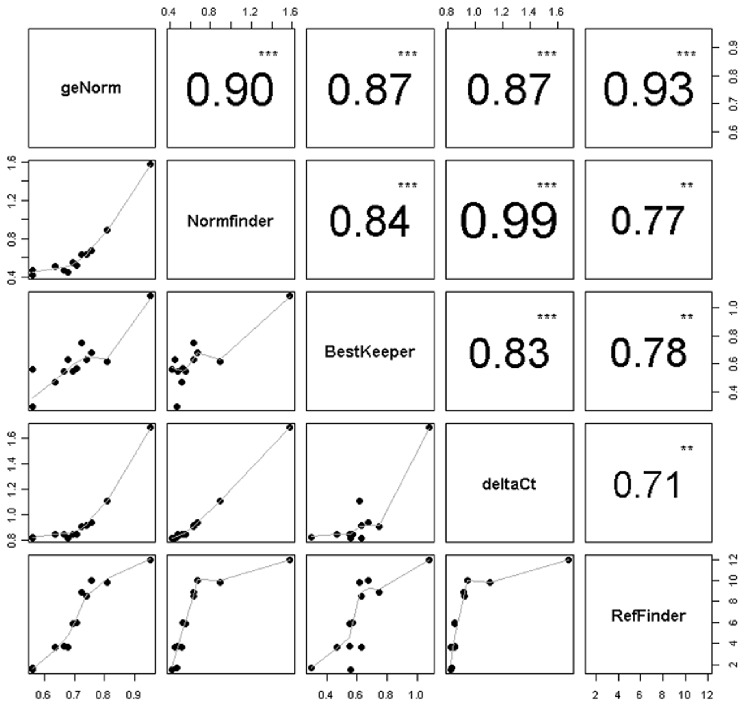
Figure 4. Correlation matrix visualizing reference genes ranked by five different stability tests (geNorm, Normfinder, BestKeeper, deltaCt and RefFinder).
Absolute value of Pearson correlation and p-value indicated by asterisks (0***, 0.01**). Bottom of the scatter plots visualizes bivariate correlation among investigated stability tests including a fitted line.

