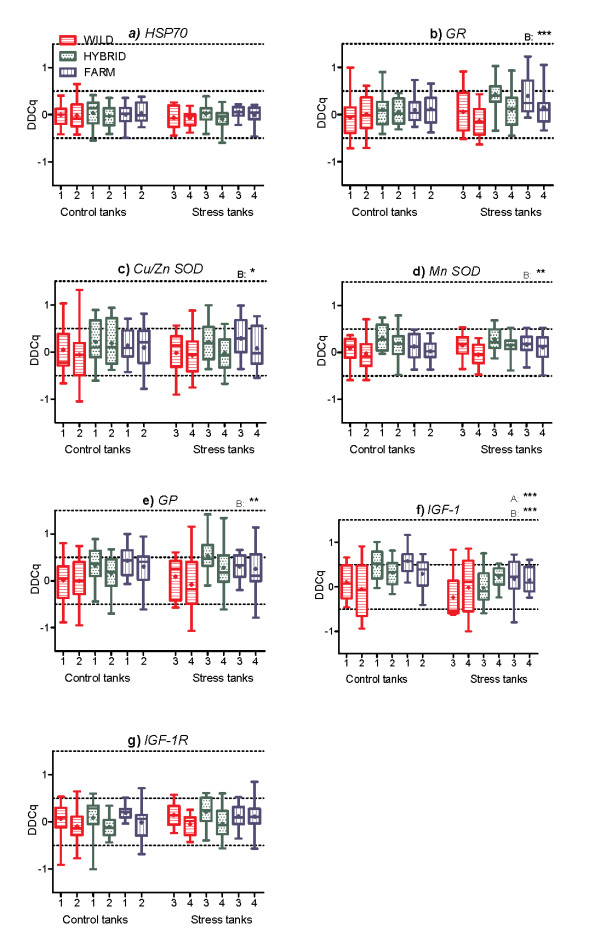
Figure 2.
qPCR analyses of the seven selected genes in salmon of farmed, hybrid and wild origin. Expressions of a) HSP70, b) GR, c) Cu/Zn SOD, d) Mn SOD, e) GP, f) IGF-1 and g) IGF-1R in Atlantic salmon of wild, hybrid and farmed origin, reared in a standard hatchery environment (tank 1 and 2) or in addition exposed to environmentally induced stress (tank 3 and 4). One quantification cycle (Cq) equals a doubling of the amount of mRNA (2^Cq). All values are relative to the wild salmon in control treatment (pooled), and ΔΔCq values with positive and negative values indicate upregulated and downregulated mRNA levels, respectively. Boxes show the median (thick line), mean (+), 1st and 3rd quartiles (lower and upper boundary) and the lower and upper extreme (whiskers). The statistical significance of the effect of treatment (A) and type (B) on gene expressions is marked with asterisks, where * = P ≤ 0.05, ** = P ≤ 0.01 and *** = P ≤ 0.001.

