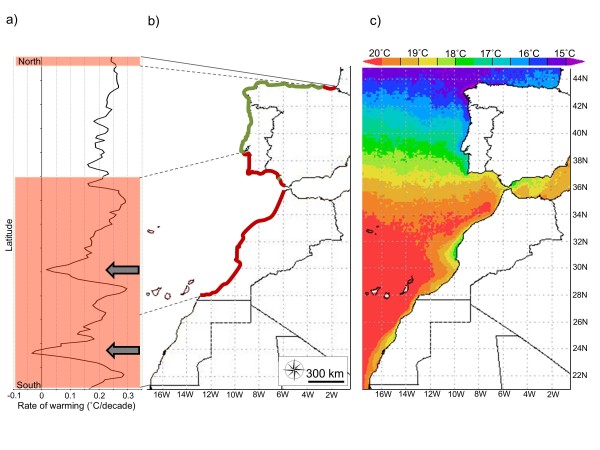
Figure 2.
Species distribution and temperature trends along the study area. (a) Coastal SST warming data over the last three decades (°C/decade; 1982 to 2011) based on AVHRR, NOAA Optimum Interpolation ¼ Degree Daily Sea Surface Temperature Analysis data. Arrows indicate areas of intense upwelling. (b) Current and past distribution and endpoints of F. vesiculosus based on data from our field survey (2009 to 2011) and on literature information and herbarium collections, red and green lines are contractions and present distribution, respectively. (c) Monthly averaged (2009 to 2011) sea surface temperature; 4 km resolution based on MODIS-Aqua dataset. MODIS-Aqua, Moderate Resolution Imaging Spectroradiometer-Aqua; SST, sea surface temperature.

