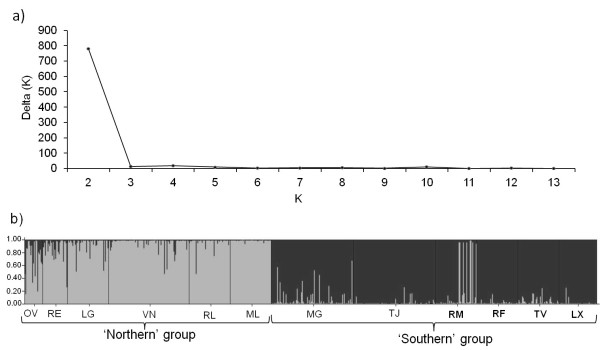
Figure 4.

Histogram of STRUCTURE assignment of genotypes to clusters. (a) Plot of deltaK (an ad hoc statistic based on the rate of change in the log probability of data between successive K values and used to predict the real number of clusters [101]) where the modal value of the distribution is considered as the highest level of structuring, in our case two clusters. (b) Genetic structure of populations defined by STRUCTURE software where each vertical bar represents an individual. The membership for each individual is indicated by partitioning the corresponding line into several parts with different colors. Codes correspond to locations in Figure 1 and extinct populations are shown in bold.
