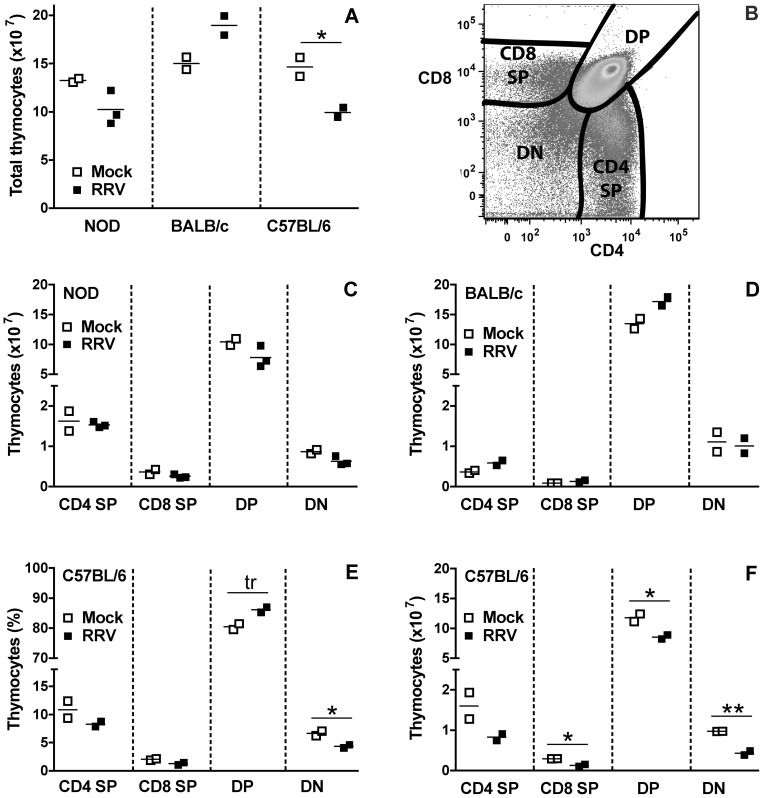
Figure 5. Effect of RRV on T cell populations in the thymus of mice at 14 days post infection.
A, Total number of thymocytes obtained. B, Flow cytometry gating strategy for identification of the frequency of the CD4 SP, CD8 SP, DP and DN thymyocyte subsets. The absolute number of each thymyocyte subset in NOD and BALB/c analysed in A is shown in C and D, respectively. The frequency (E) and absolute number (F) of thymyocyte subsets in C57BL/6 mice analysed in A was determined by flow cytometry gating and cell counts, respectively. For A to F, each data point indicates results from a pool of cells from 2 to 4 mice, normalized to represent cells obtained/mouse. Cell pooling was necessary to obtain sufficient cells for analysis. Bar = mean. * 0.02 ≤ p ≤ 0.04; ** p = 0.008; tr = trend, p = 0.05.

