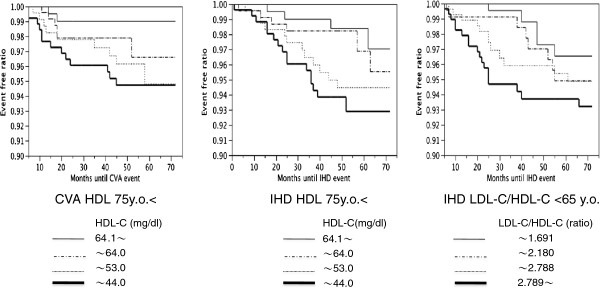
Figure 3.

The relationships of HDL-C levels and the LDL-C/HDL-C ratio with IHD and CVA in quartile categories for each age group based on Kaplan-Meier estimator curves. Left: The LDL-C/HDL-C ratio correlates with IHD. The figure shows the data for individuals aged <65 years. Center: The HDL-C level was inversely correlated with IHD, particularly in individuals aged >75 years. Right: The association between CVA and HDL-C was more prominent in those individuals aged ≥ 75 years. Quartile categories HDL-C:  <44.0,
  44.1-53.0,
  53.1-64.0,
  >64.1 mg/dl LDL-C/HDL-C:
  <1.691,
 1.692-2.180,
  2.181-2.787,
  >2.789.
