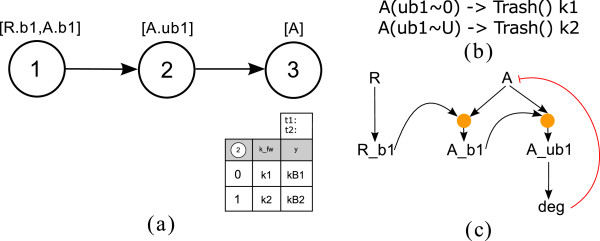
Figure 18.

Example containing a degradation process. In (a) the PIM is shown: Node 1 represents a binding process of molecule A to molecule R; process 2 is a modification (ubiquitination) process on molecule A. Process 3 represents the degradation of molecule A which depends on the previous ubiquitination. The parameter table contains one input column for the influencing modification process. In (b) the corresponding reaction rules for process node 3 are listed in BNGL; and (c) shows the logical model for the PIM introduced in (a).
