
Figure 9. Effect of nicotine on pit formation.
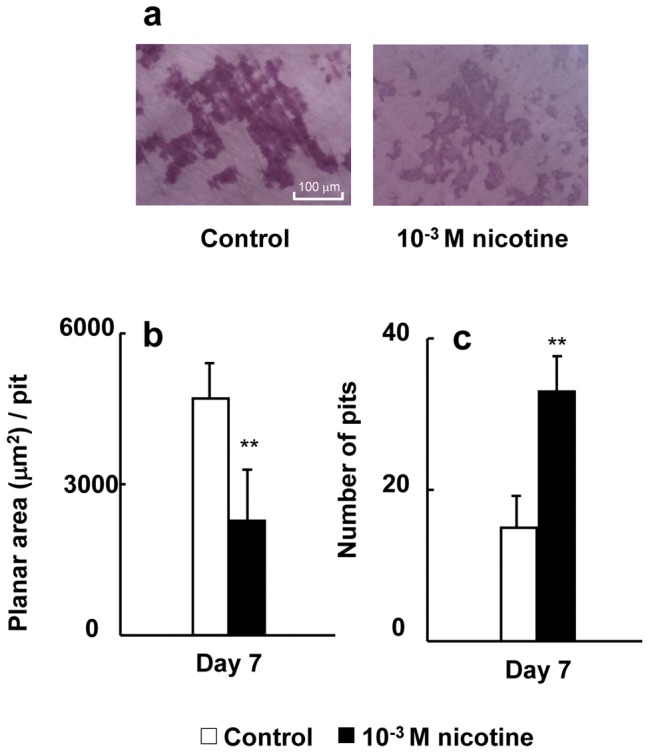
RAW264.7 cells were plated onto dentin slices and cultured in differentiation medium with 0 (control) or 10−3 M nicotine for 7 days. Representative the resorption pits of control or 10−3 M nicotine by osteoclasts (a). The pits were quantified by tracing the perimeter of each pit to obtain the mean planar pit area under each condition. The histogram shows the average planar area of each pit under the control or 10−3 M nicotine condition on day 7 of culture (b). Data are expressed as the mean±S.D., n = 3 independent experiments, each performed using triplicate coverslips with five randomly selected osteoclasts analyzed per coverslip The number of pits was counted under a phase-contrast microscope on day 7 of culture (c). Data are shown as the mean±S.D., n = 3 independent experiments, each performed using quintuplicate wells. **p<0.01, nicotine treatment vs. control. **p<0.01 nicotine treatment vs. control.