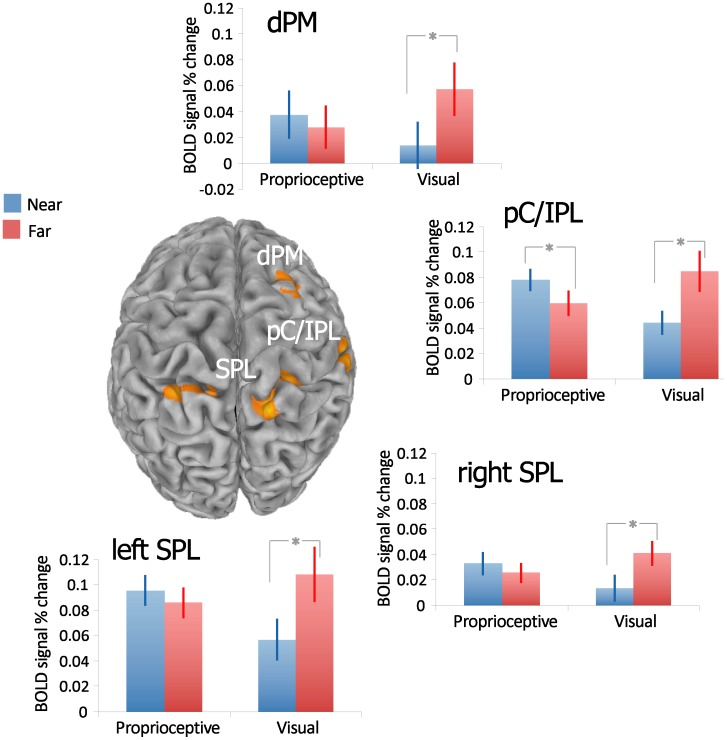
Figure 3. Grasping-related areas are modulated by the sensory modality x object distance interaction.
Statistical map shows the Sensory Modality x Object Distance interaction within the ANOVA. Spatially normalized activations are projected onto a single-subject brain template in Talairach space. Bar graphs illustrate the mean ± SE of the relative BOLD signal intensity (% change) across the experimental conditions for each of the significant clusters. Significance for distance effect in each sensory modality conditions was reported for T-test p-value<0.05. dPM – dorsal premotor; pC/IPL – post central cortex/inferior parietal lobule; SPL – superior parietal lobule.

