
Figure 6. Generation of CD4+CD25highFoxp3+ T cells by DC/tumor.
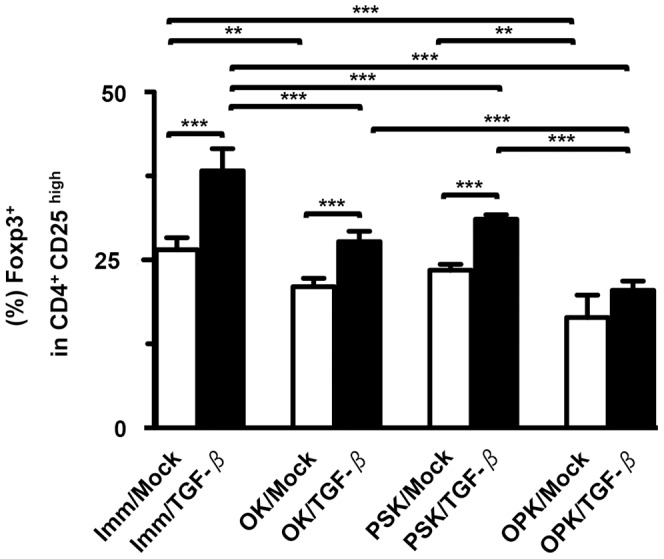
T cells (n = 5) were stimulated by eight types of DC/tumor (Imm/Mock, OK/Mock, PSK/Mock, OPK/Mock, Imm/TGF-β, OK/TGF-β, PSK/TGF-β, and OPK/TGF-β) and stained with Cy5-conjugated mAbs against CD4, FITC-conjugated mAbs against CD25, and PE-conjugated mAbs against Foxp3. To identify Foxp3+ cells in the CD4+CD25high T cells, T cell populations were gated based on their forward- vs. side-scatter profile. CD4+CD25high T cells were then analyzed for Foxp3 expression. The percentage of Foxp3+ cells among total CD4+CD25high T cells is expressed as the mean ± SD. ***P<0.001; **P<0.01; *P<0.05.