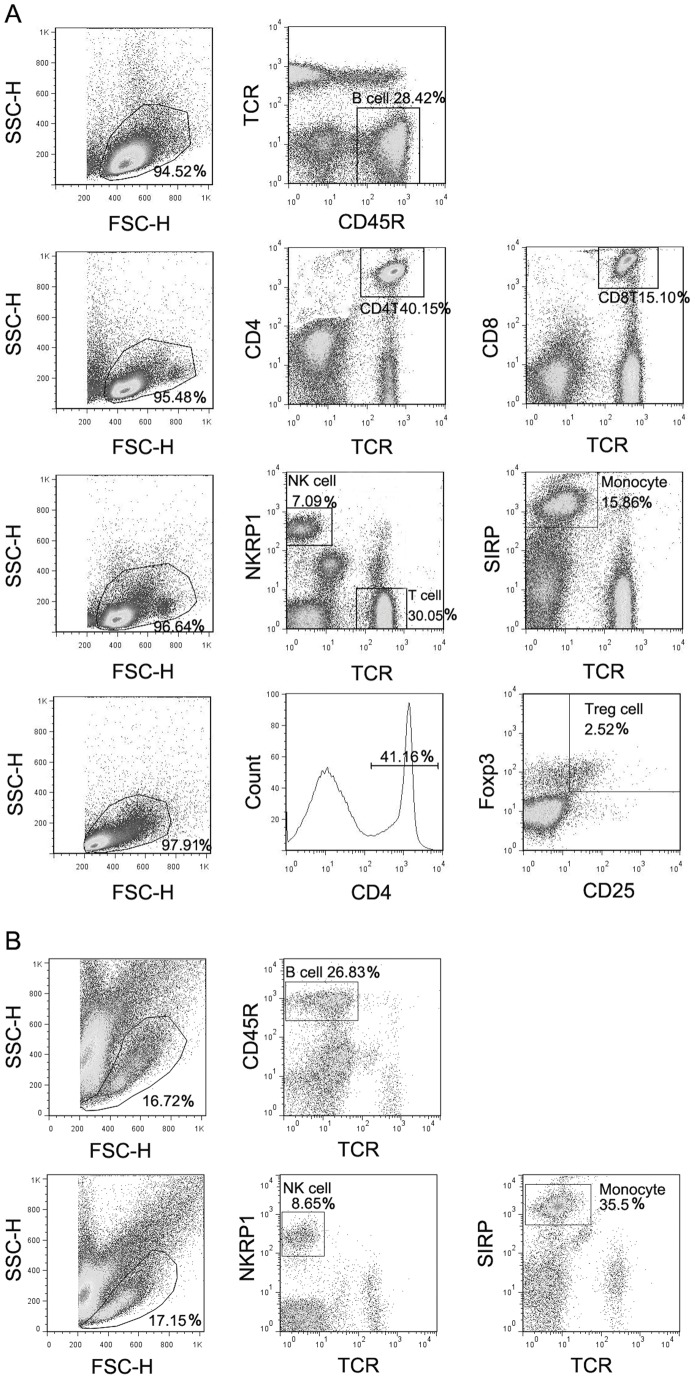
Figure 3. Gating strategy for immune cell subpopulations in the blood and spleen.
Blood was harvested from the tail vein 3 d after stroke and total PBMCs were isolated for immunostaining. The first column in each row shows the gated total PBMCs based on Forward Scatter (FSC) and Side Scatter (SSC) parameters. Further analyses after immunofluorescent staining for specific cell populations are shown in columns 2 and 3. The relative percentage of the gated population is shown at the corner. Cell populations are defined as: B cells, CD45R+TCR−; CD4+ T cells, CD4+TCR+; CD8+ T cells, CD8+TCR+; macrophages, SIRP+TCR−; NK cells, NKR+TCR; Tregs, CD4+CD25+FoxP3+. A. Representative FACS profiles after gating to detect cell types in WT rats. B. Representative FACS profiles after gating to detect cell types in nude rats.

