
Figure 8. HMGB1 levels in the plasma and corresponding total number of PBMCs after splenectomy or treatment with Glycyrrhizin followed by stroke.
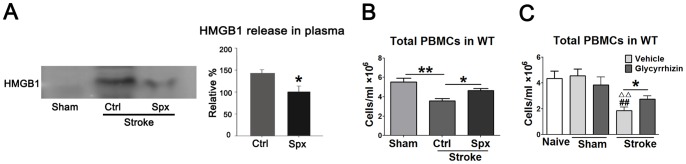
A. Western blot detected HMGB1 release in the plasma 48 h after stroke in rats with and without splenectomy. The left panel shows representative results of Western blot for HMGB1. Note that no control protein, such as β-actin, was used to show even loading, because the examined samples are plasma, for which the same amount volume (15 μl) from different animals was loaded. The bar graphs in the right panel show the average optical density of protein bands. The relative density of protein bands in rats receiving splenectomy plus stroke was set as 100%. * vs. control (stroke without splenectomy), P<0.05, n = 4/group. B. Total number of PBMCs in stroke rats with or without splenectomy. Forty-eight hours after stroke followed splenectomy, blood was harvested and total PBMCs were isolated and counted. Splenectomy significantly attenuated reduction in total number of PBMCs induced by stroke. *, ** vs. control, p<0.05, 0.01, respectively. N = 9–11/group. Ctrl: Control; Spx: splenectomy. C. Total number of PBMCs in stroke rats treated with or without glycyrrhizin. Glycyrrhizin (200 mg/kg) was injected intraperitoneally immediately before stroke and 2 h after reperfusion. The blood was harvested and total PBMCs were isolated and counted 3 d post stroke. Glycyrrhizin significantly reversed the reduction in total PBMCs induced by stroke in vehicle. ## vs. naïve, ΔΔ, vs. Sham, p<0.01, * vs. vehicle, p<0.05. N = 9–11/group.