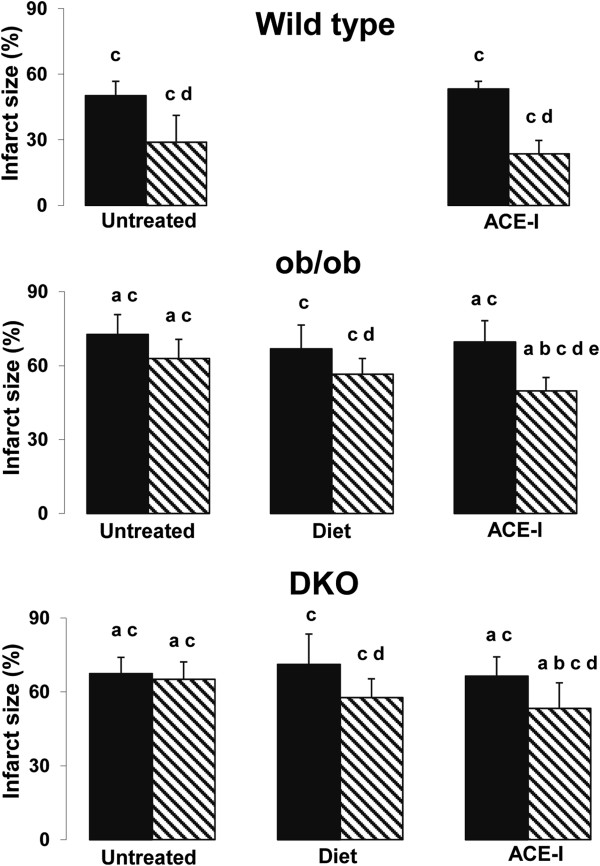
Figure 2.
Infarct size as % of risk zone in wild type, ob/ob and double knock-out mice. Black bar: Non-preconditioned and IR injury; Dashed bar: Preconditioned and IR injury “a” p<0.05 versus WT same treatment, same condition (sham; non-preconditioned; preconditioned); “b” p<0.05 versus same untreated genotype, same condition; “c” p<0.05 versus sham, same genotype, same treatment; “d” p<0.05 versus non preconditioned, same genotype, same treatment; “e” p<0.05 versus diet, same genotype, same condition.

