Figure 3.

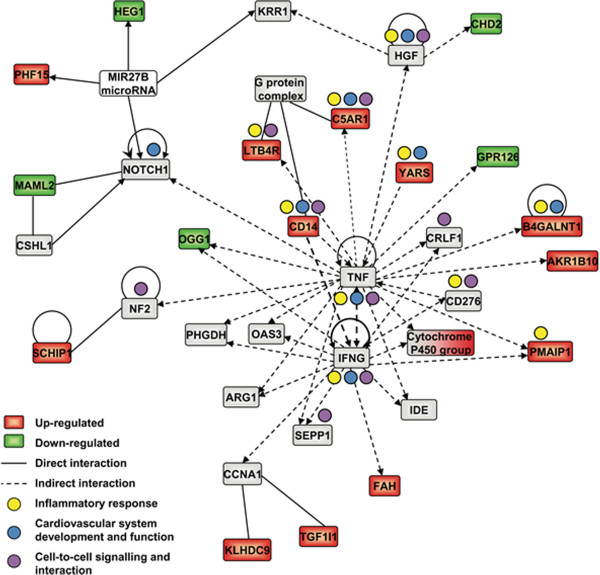
Interactions of network 7. Graphical presentation of network 7, obtained by IPA network analysis of microarray data of differential gene expression in HepG2 cells after exposure to 218 μg/ml Padma 28 ethanolic extract for 18 h.

Interactions of network 7. Graphical presentation of network 7, obtained by IPA network analysis of microarray data of differential gene expression in HepG2 cells after exposure to 218 μg/ml Padma 28 ethanolic extract for 18 h.