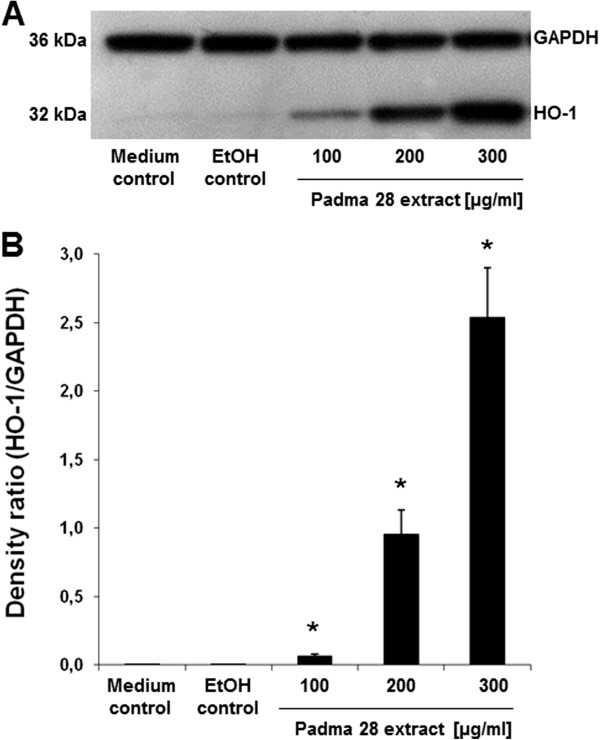
Figure 6.

Heme oxygenase-1 (HO-1) protein expression. Stimulation of heme oxygenase-1 (HO-1) expression after treatment of HepG2 cells with increasing concentrations of Padma 28 (100–300 μg/ml) for 18 h. (A) A representative western blot of HO-1 protein expression is shown. (B) Densitometric analysis of HO-1/GAPDH expression. Mean values ± S.E.M. of three independent experiments (*p<0.05, compared to the solvent control) are shown.
