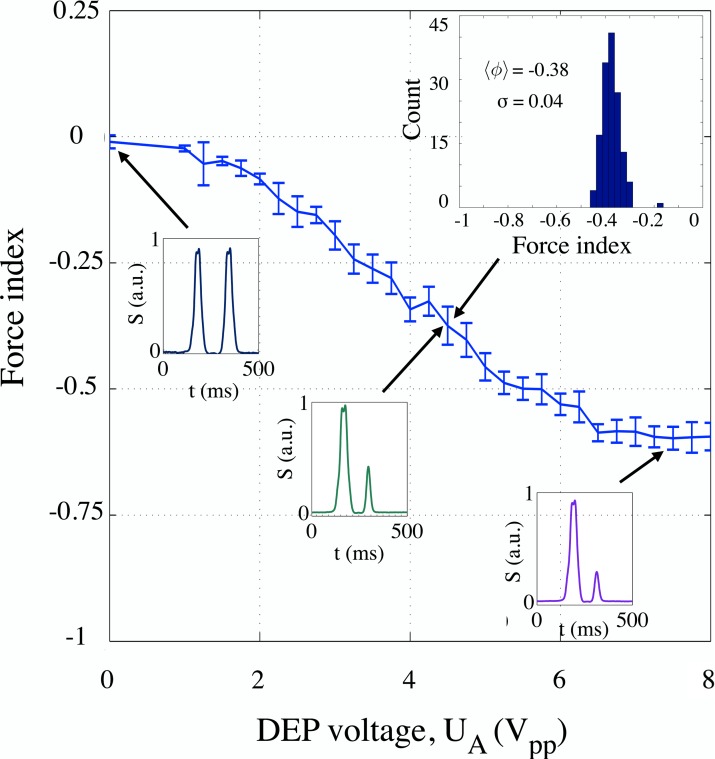
Figure 4.
Mean force index values for PSS populations actuated at 1 MHz by signals of amplitudes 0 to , in steps of . Inset shows an example of the force index histogram for with the mean force index and standard deviation as indicated. Examples of individual signatures produced by PSS entering the analysis volume at about the same altitude are provided for different actuation voltages, UA (values of 0, 4.5 and , as indicated by arrows). The response has a linear characteristic for signal amplitudes between about 2 and ; the change in voltage of about results in an observable change in force index of about 0.025. This allows us to use the force index to estimate the actuation and the corresponding expected change in polarizability.

