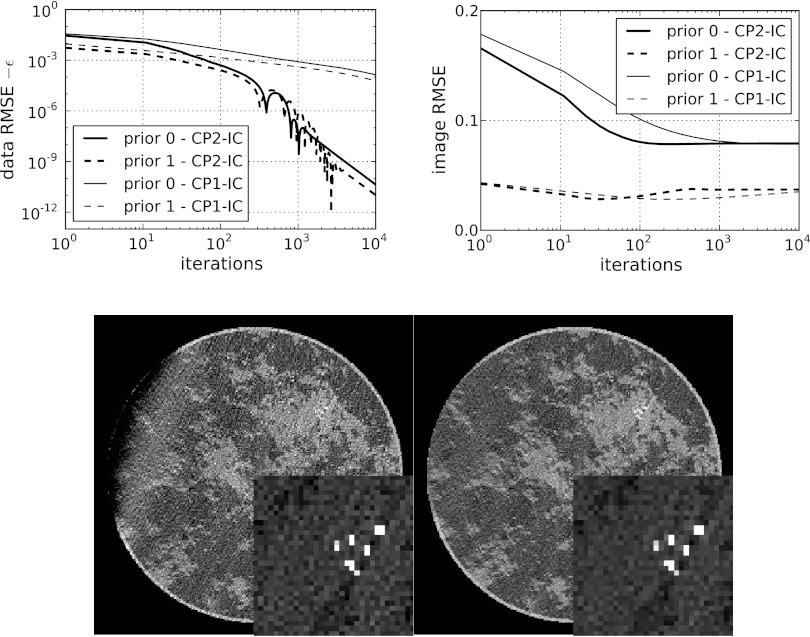
Figure 8.
Results of CP2-IC and CP1-IC with noisy and inconsistent, simulated data. The curves labeled “prior 0” correspond to a zero prior image. The curves labeled “prior 1” correspond to a prior image of 1.0 on the object support. (Top) (left) convergence of the data RMSE to the preset value of ε = 0.002 and (right) image RMSE. (Bottom) (Left) “prior 0” final image, and (Right) “prior 1” final image. Gray scales are the same as Fig. 3. The comparison between CP2-EC and CP1-EC shows quantitatively the impact of the acceleration afforded by CP Algorithm 2.

