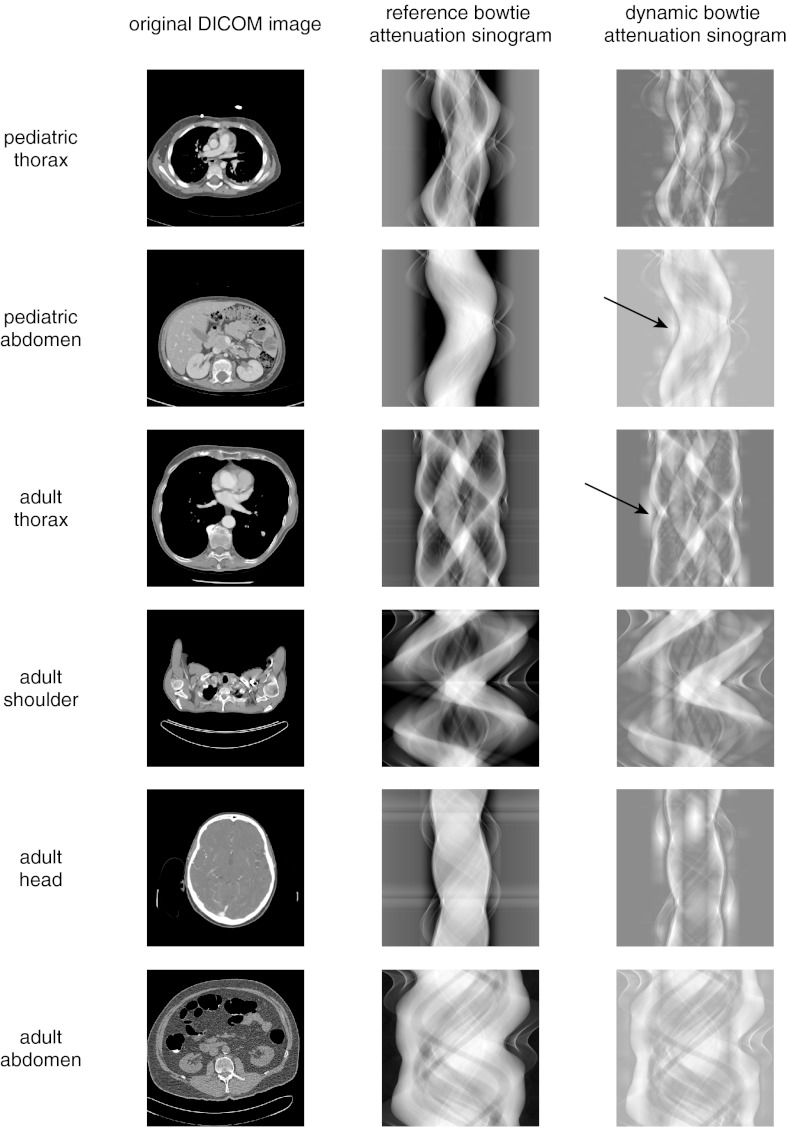
Figure 6.
Attenuation sinograms from the dynamic range minimization task. The attenuation sinogram is the attenuation of the object added to the attenuation provided by the system through either the bowtie or the virtual attenuation of tube current modulation. In the dynamic attenuation sinogram, the triangular pieces of the piecewise-linear attenuation function can sometimes be seen (arrows).

