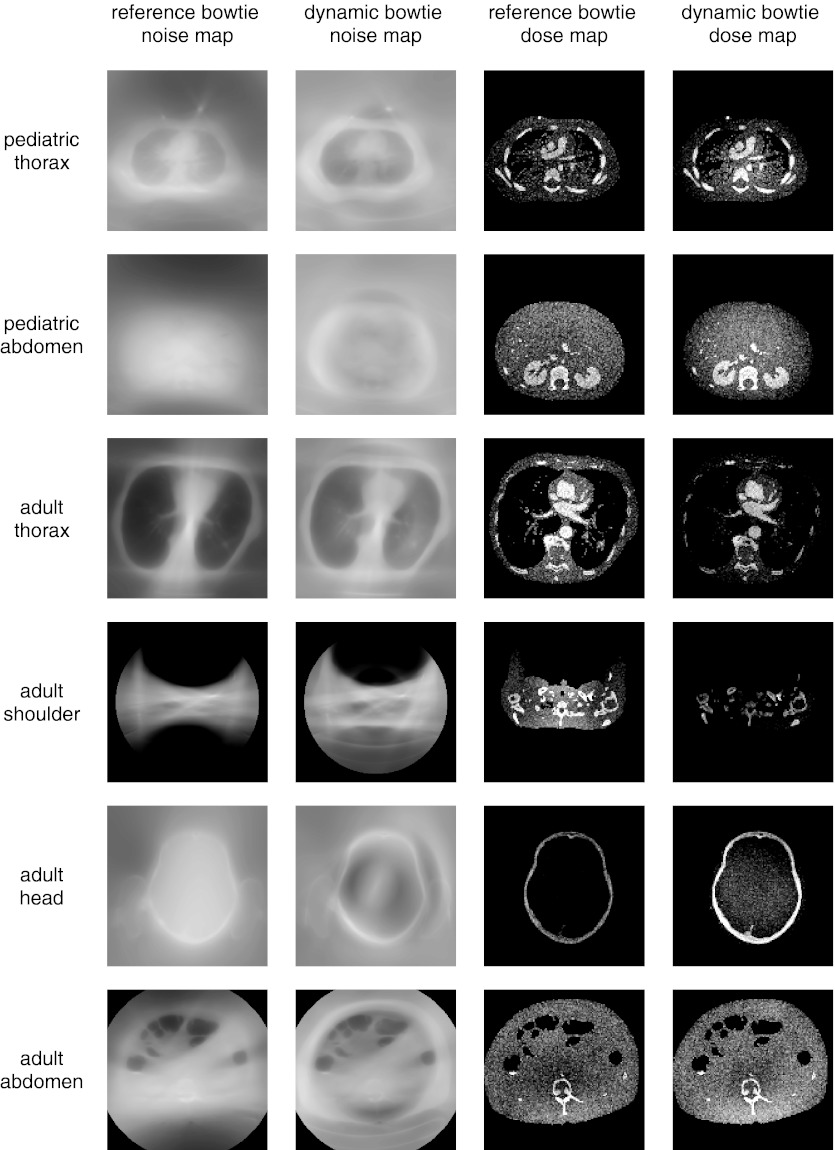
Figure 7.
Visualization of the relative standard deviation and dose for the dynamic bowtie and reference systems. The dynamic bowtie here minimizes dynamic range everywhere, causing the noise to often be highest near the boundary of the object and the air. This is most cleanly visualized in the adult head. Summary statistics are also provided in Table 3.

