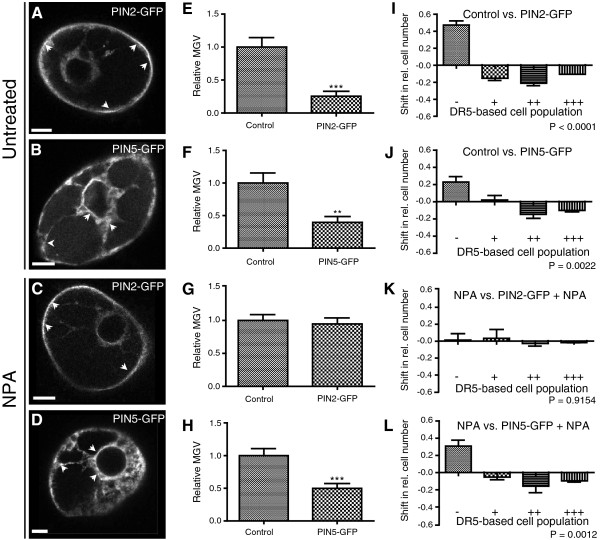
Figure 4.
Effect of PIN protein activity on cellular auxin homeostasis. (A) Preferential PIN2-GFP localization at the plasma membrane. (B) Typical perinuclear ER localization of PIN5-GFP. (C,D) PIN2-GFP and PIN5-GFP localization is not affected in the presence of the auxin transport inhibitor NPA (application with 10 μM NPA-enriched medium). Arrowheads depict preferential PIN2 and PIN5 localizations at the PM and ER, respectively. Bars = 10 μm. (E,I,F,J) Cells co-transformed with DR5rev:mRFP and either 35S:PIN2-GFP or 35S:PIN5-GFP had a lower DR5rev:mRFP signal intensity than the control cells expressing DR5rev:mRFP and the inert ER marker 35S:HDEL-GFP. (G,H,K,L) In the presence of NPA, PIN5-GFP but not PIN2-GFP expression decreases DR5rev:mRFP signal intensity. (E-H) Graphs represent the relative average mean gray values (MGV) of the DR5rev:mRFP signal intensity. Error bars represent standard error (n = 60). Statistical significance was evaluated with the unpaired student T-test (* P < 0.05, ** P < 0.01, *** P < 0.0001). (I-L) Graphs depict the change in relative number of transformed cells displaying a low (-), medium (+), high (++), and very high (+++) DR5rev:mRFP signal intensity between the two samples (for detailed description of the quantification, see Additional file 1: Figure S2). Error bars represent standard error (n = 3 repetitions with at least 50 counted cells). Statistical significance was evaluated with the ANOVA test; the P- value is indicated.

