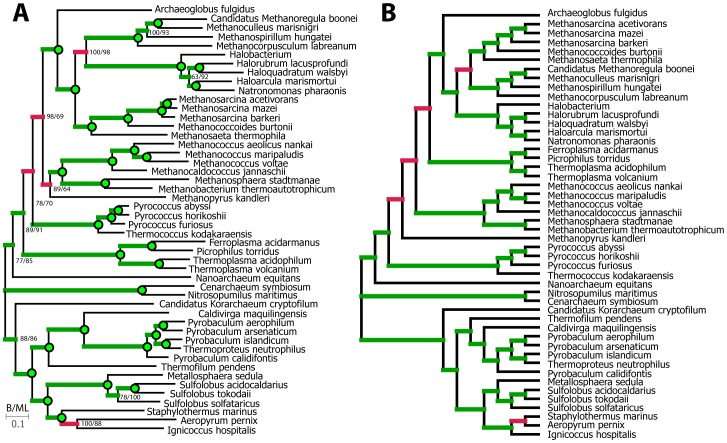
Figure 3. Comparison of DendroBLAST derived supertree with concatenated protein sequence phylogeny.
A) Phylogenetic tree produced from concatenated multiple sequence alignment using maximum likelihood and Bayesian methods. Green circles indicate 100% support under both methods. Numbers at nodes indicate percent support from bootstrapped analyses. Green branches indicate bipartitions found in tree B, red branches indicate bipartitions absent from tree B. B) Supertree constructed from quartets derived from DendroBLAST trees. Green branches indicate bipartitions found in tree A, red branches indicate bipartitions not found in tree A.

