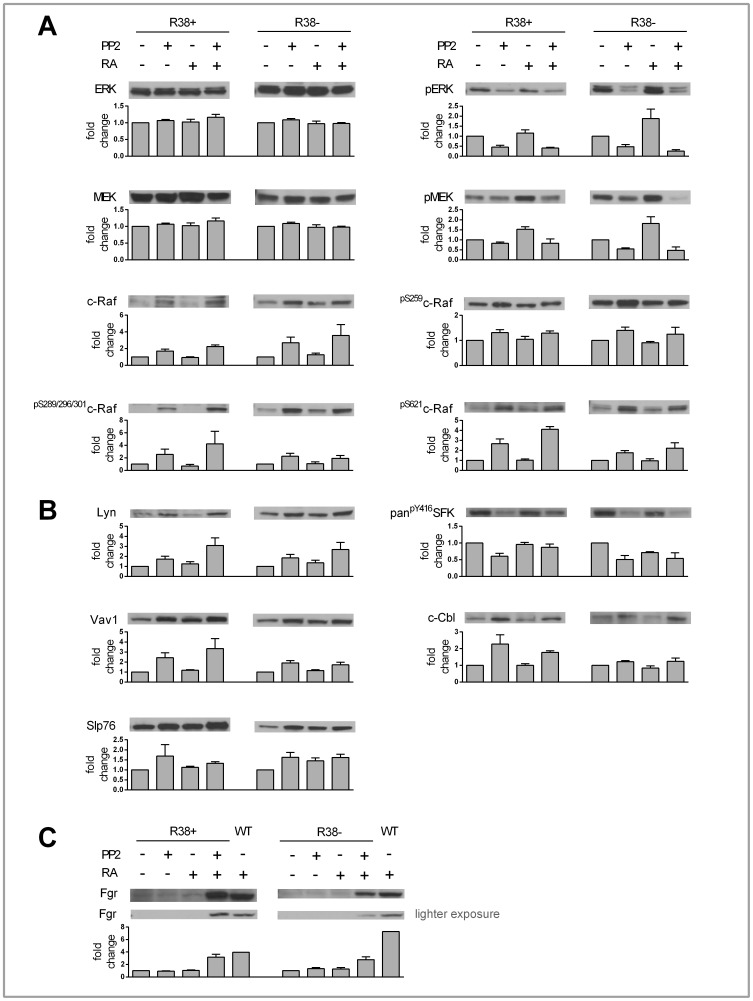
Figure 5. 48 h Western blot data for control, PP2, RA and PP2+RA treated R38+ and R38.
−. A representative blot is displayed above its respective bar graph, and each bar graph (error bars represent standard error) presents the fold change respective to each control. The fold change was calculated after performing densitometry across three or more repeated blots. Note that the scale of the y-axis for each bar graph differs. A: There was no change in total ERK or MEK levels during any treatment for either R38+ or R38−. Interestingly, PP2 (alone and when co-treated with RA) decreased MEK and ERK phosphorylation in both R38+ and R38−. However PP2 and PP2+RA treatment induced upregulation of c-Raf expression and c-Raf phosphorylation at S259, S621 and S289/296/301 in both R38+ and R38−. B: PP2 and PP2+RA induced upregulation of Lyn, Vav1, c-Cbl and Slp76 expression. Y416 phosphorylation was reduced with PP2 treatment. C: Fgr can be detected with combined RA and PP2 treatment, but not with PP2 alone in both R38+ and R38−. Although the blots of Fgr were repeated three or more times, the blot that additionally displays the band for RA-treated WT HL60 (in the blot shown) was performed once. GAPDH (not shown) served as loading control.

