
Figure 3. The correlation between expression level of PLAG1 and IGF2 expression levels in placentas.
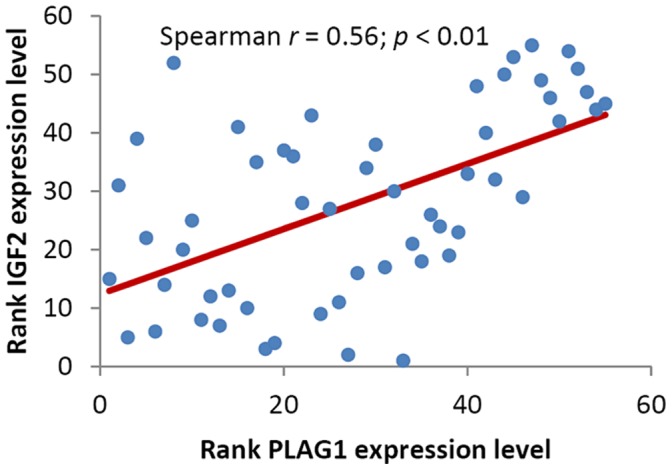
The correlation was calculated by Spearman correlation analysis (Spearman r = 0.56, p<0.0001).
Official websites use .gov
A
.gov website belongs to an official
government organization in the United States.
Secure .gov websites use HTTPS
A lock (
) or https:// means you've safely
connected to the .gov website. Share sensitive
information only on official, secure websites.
The correlation was calculated by Spearman correlation analysis (Spearman r = 0.56, p<0.0001).