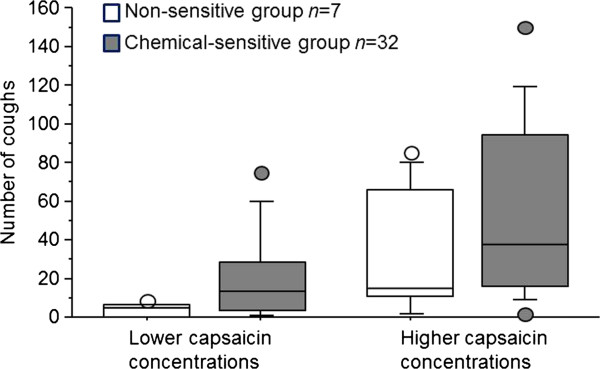
Figure 1.

Box plot presentation of cough response in 39 patients with chronic cough after inhalation of lower (0.4 or 0.06 μmol/L) and higher (2.0 or 0.3 μmol/L) capsaicin concentrations. The horizontal line in the centre of each box is the median. The top and bottom of the box represent the 25th and 75th percentiles, and whiskers indicate the 10th and 90th percentiles. Circles show individual maximum and minimum data points.
