Figure 3.

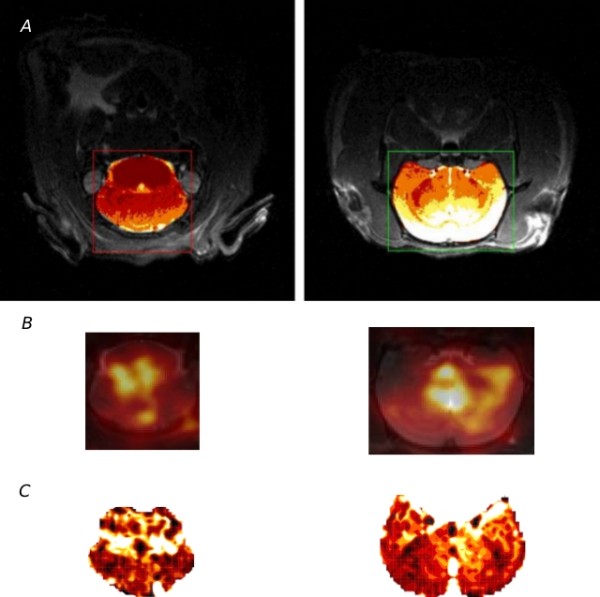
Direct comparison of the two sections marked on MR-anatomical image on the top. (A) radioactively labeled microsphere distribution measured by PET overlayed with MR-anatomical image (B) and ASL perfusion parametric image (C).

Direct comparison of the two sections marked on MR-anatomical image on the top. (A) radioactively labeled microsphere distribution measured by PET overlayed with MR-anatomical image (B) and ASL perfusion parametric image (C).