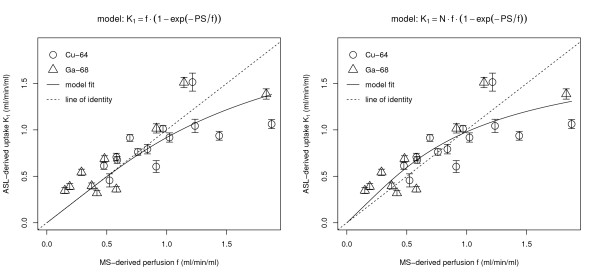
Figure 5.

Least squares fit of the Renkin-Crone model to the data. Left: standard Renkin-Crone model (Equation 13). Right: Renkin-Crone model with additional scaling factor (Equation 14).

Least squares fit of the Renkin-Crone model to the data. Left: standard Renkin-Crone model (Equation 13). Right: Renkin-Crone model with additional scaling factor (Equation 14).