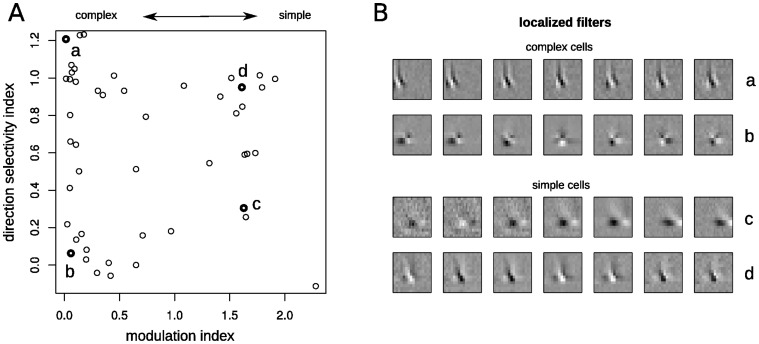
Figure 4. Diversity of response properties across a population of simple and complex cells.
A. Empirically measured modulation index and direction selectivity values for 51 V1 cells (see Fig. 3, Rust et. al. 2005). The population contains simple and complex cells with varying degrees of direction selectivity. B. Both simple and complex cells display sensitivity consistent with multiple localized inputs (shown are 7 localized filters spanning the region RF of the individual cells indicated in A).

