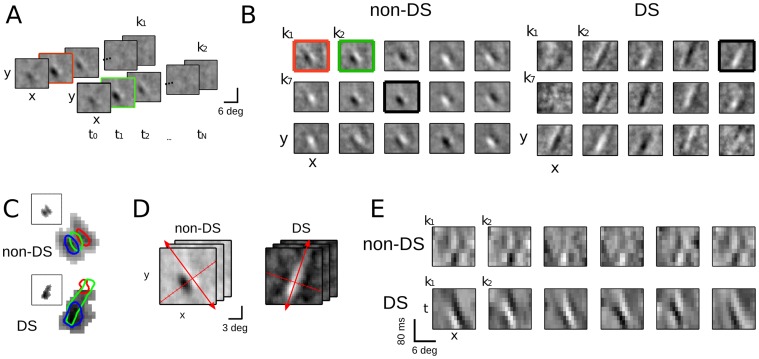
Figure 8. Receptive fields can be estimated from responses to naturalistic movies.
A. Two filters found by applying the STC and localization methods to a V1 complex cell recorded in the context of naturalistic movies. To represent the three dimensions of the filters (two spatial and one temporal), the filters are shown as a series of two-dimensional (2-D) spatial plots across latencies. B. The set of localized filters across space for an example non-DS neuron (14,664 spikes, DSI = 0.05, left) and DS neuron (2,628 spikes, DSI = 0.51, right). Here, each filter is represented by its 2-D spatial slice at 40 ms latency, which is the latency with maximal spatial power, i.e., variance across pixels (green and red outlined frames in A). The 15 spatial maps shown in each case are examples of localized filters centered on different spatial locations. C. A density plot showing the total temporal power across all localized filters for the non-DS (top) and DS (bottom) neurons, demonstrating that - despite using a range of locations for the localization method - localized filters only exist in a defined region. Rectangular insets indicate the relative size and position of the spatial filter, and the colored contours overlaid on density plot show the outline of three example localized filters. D. To compare with the results from the analysis on the random bars data (Figs. 1–5), spatiotemporal slices oriented in the neuron’s preferred direction (red arrows) are computed, and spatially projected on the axis perpendicular (red tick marks). E. Projections along the direction indicated in (D) for each neuron’s localized filters reveal x-t plots that are consistent with the 1-D dataset and illustrate differences in direction selectivity between the cells shown in (B) and (C).

