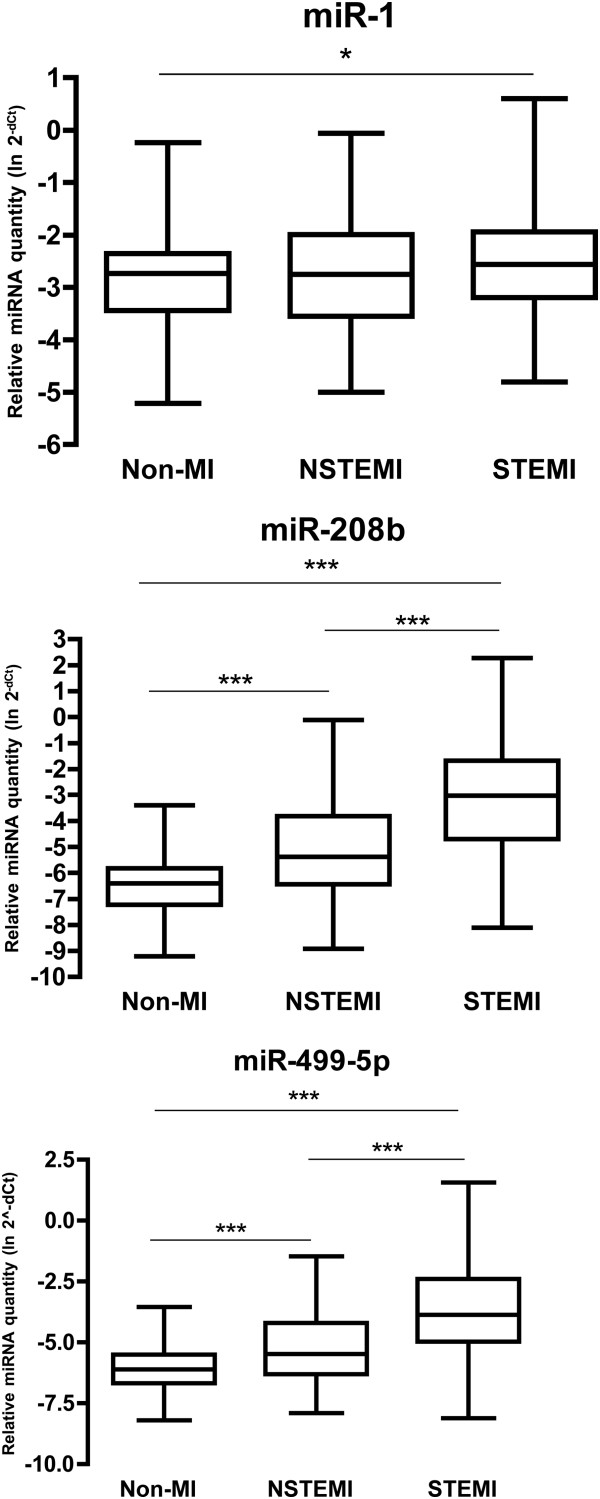
Figure 2.
MiRNA levels across patient groups. MiRNA levels relative to miR-17, transformed into linear form using the formula 2-dCt. All quantities have been transformed using the natural logarithm. The box extends from the 25th percentile to the 75th percentile with a line at the median. The whiskers indicate the highest and the lowest value in each group. *p < 0.05, ***p < 0.001.

