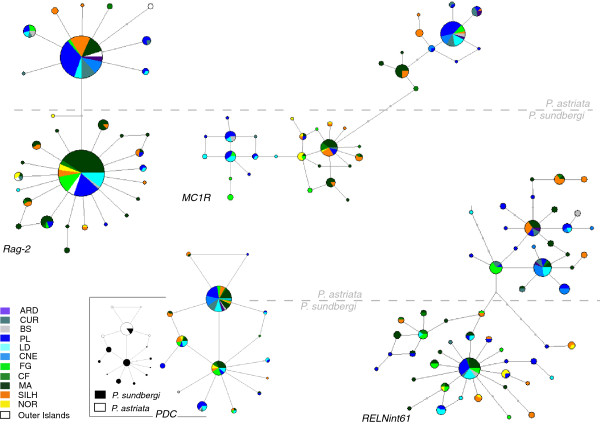
Figure 3.
MJ networks representing nuclear DNA variation. Islands are colour-coded and circle size is proportional to the number of individuals. Labelling is the same as in Figure 2. Full grey dots along branches represent missing or unsampled haplotypes. Clades above and below the dashed horizontal line correspond to P. astriata and P. sundbergi, respectively (except for PDC where haplotype sharing is observed – inset network). The gene to which each network corresponds is identified on its inferior left corner.

