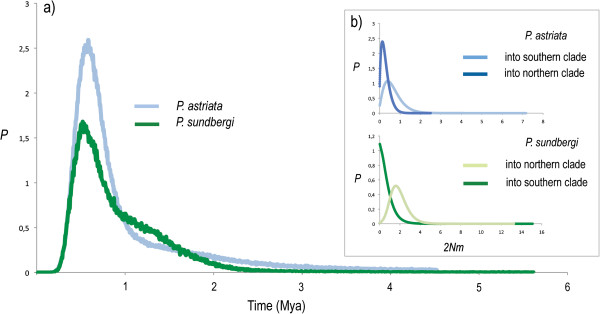
Figure 4.

a) Probability distribution for the splitting time between northern and southern clades of P. astriata (light blue) and P. sundbergi (dark green); b) number of migrant gene copies per generation (2 Nm) between those same clades within P. astriata (blue, upper) and P. sundbergi (green, down).
