
Figure 3.
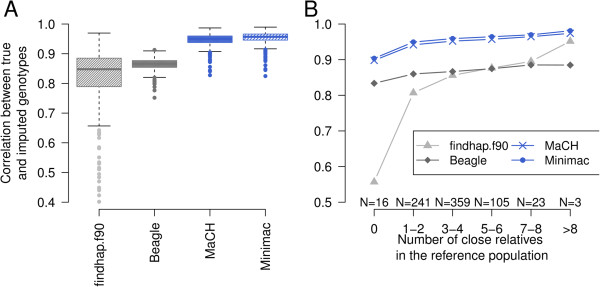
Individual imputation accuracy for the scenario with 50 reference animals. Barplots indicate the correlation between true and imputed genotypes (rTG,IG) for 747 animals based on 50 reference animals (A). The individual rTG,IG increased considerably as the number of close relatives increased (coefficient of relationship >0.12) in the reference population (B).