
Figure 4.
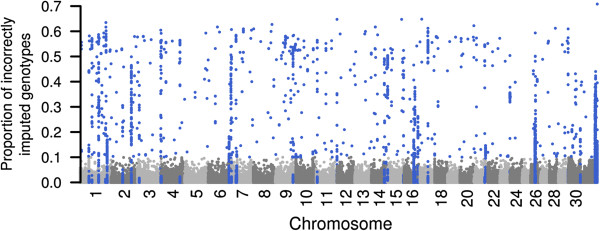
Genome-wide distribution of the proportion of correctly imputed genotypes. Genotypes of 599 535 SNP were imputed for 397 animals based on haplotype information of 400 reference animals using Minimac. Blue dots represent 5039 SNP within regions of poor imputation quality probably representing misplaced SNP.