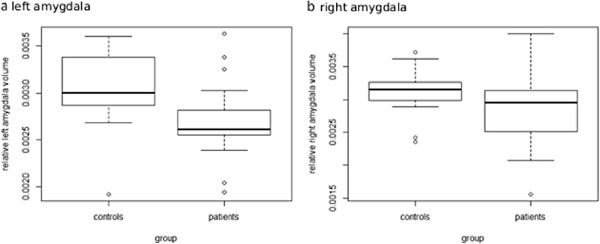
Figure 2.

Amygdala volumes of spider phobic patients and healthy controls. The central box shows the data between 25th and 75th quartiles, with the median represented by the line. The whiskers extend from the upper and lower quartiles to a distance of 1.5 interquartile range (IQR). Circles represent the outliers over 3 IQR below the 25th or above the 75th quartile. Relative amygdala volumes were calculated by the following formula: 100x(absolute amygdala volume in mm2/intracranial volume in mm2). a: boxplot comparing relative left amygdala volume; b: boxplot comparing relative right amygdala volume.
