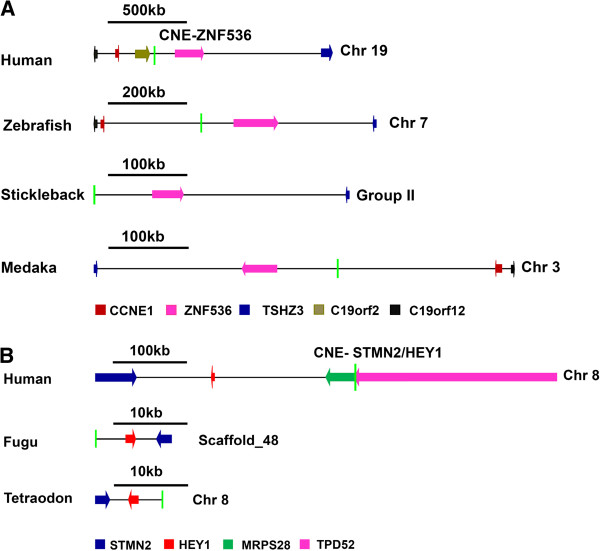
Figure 4.
CNE-enhancer induced reporter expression was compared with the endogenous expression of neighboring genes to find their probable target. In those cases where comparative synteny analysis alone was not sufficient to establish unambiguous associations among CNE-enhancers and their target gene bodies, we carefully compared the CNE-enhancer induced reporter expression pattern with the reported endogenous expression pattern of neighboring genes. (A) Both TSHZ3 and ZNF536 genes depict conserved syntenic associations with a human CNE-enhancer (hs858), suggesting either or both of these genes are under the regulatory control of this enhancer. However comparing the reporter expression induced by this CNE-enhancer with the reported endogenous expression pattern of TSHZ3 and ZNF536 depicts a precise analogy in the expression domain of ZNF536 and this enhancer interval. (B) CNE-enhancer (hs1305) within an intron of human MRPS28 gene is not associated with the promoter of the same gene, rather applying the same strategy discussed above in panel A we infer that this CNE-enhancer is acting at a distance of ~150.8 kb on HEY1 and STMN2 genes. Genes are color-coded. Direction of arrow depicts the direction of gene transcription. Light green vertical line depicts the position of CNE-enhancer. Horizontal black line depicts scale.

