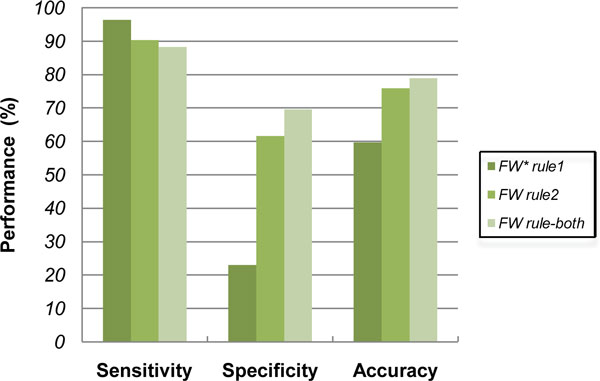
Figure 2.

The performance of FAO/WHO criteria. FW* denotes FAO/WHO. The figure displayed the comparison result of each FAO/WHO criterion. Both rule 1 and rule2 had a high sensitivity, even greater than 90% with the rule 1 individually. However the corresponding specificity was only 23.05%.
