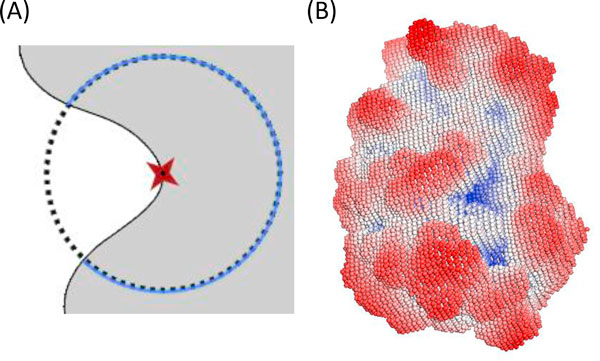
Figure 2.

Illustration of solid angle calculation. (A) A 2D representation of solid angle calculation, where Vin is the volume of the virtual sphere located within the interior regions of the query protein (blue circles), and Vsphere represents the volume of the total sphere (black circles). (B) Calculated solid angles on the surface area of the query protein (PDB ID: 1TPA). Red spheres are recognized as protruding regions, white or lighter-shaded spheres represent flat regions, and blue spheres represent concave regions on the protein surface.
