
Figure 5.
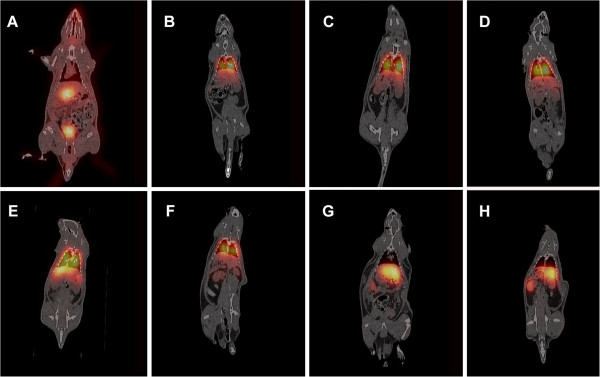
Coronal SPECT/CT fusion images illustrating the uptake of99mTc-pertechnetate and99mTc-labeled MBs in rats. (A) 99mTc-pertechnetate, (B) plain MBs, (C) DTPA MBs, (D) chitosan MBs, (E) PMAA MBs, and (F) NOTA MBs, 1 h post injection. (G) NOTA MBs, liver view, 24 h post injection. (H) NOTA MBs, kidney view, 24 h post injection.