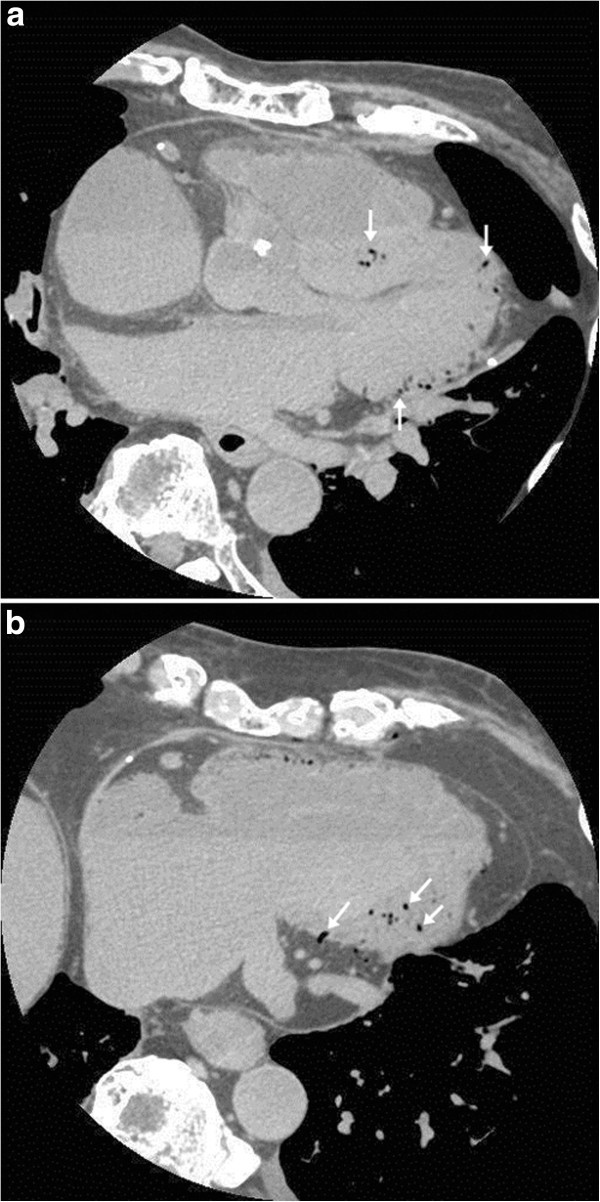
Figure 1.

Myocardial intravascular gas of the left ventricle on postmortem CT of the heart. a. Axial image at the level of aortic root shows intravascular gas in the ventricular septum, apex, and posterior wall (arrows). b. Axial image at the level of inferior wall shows intravascular gas in the inferior wall (arrows).
