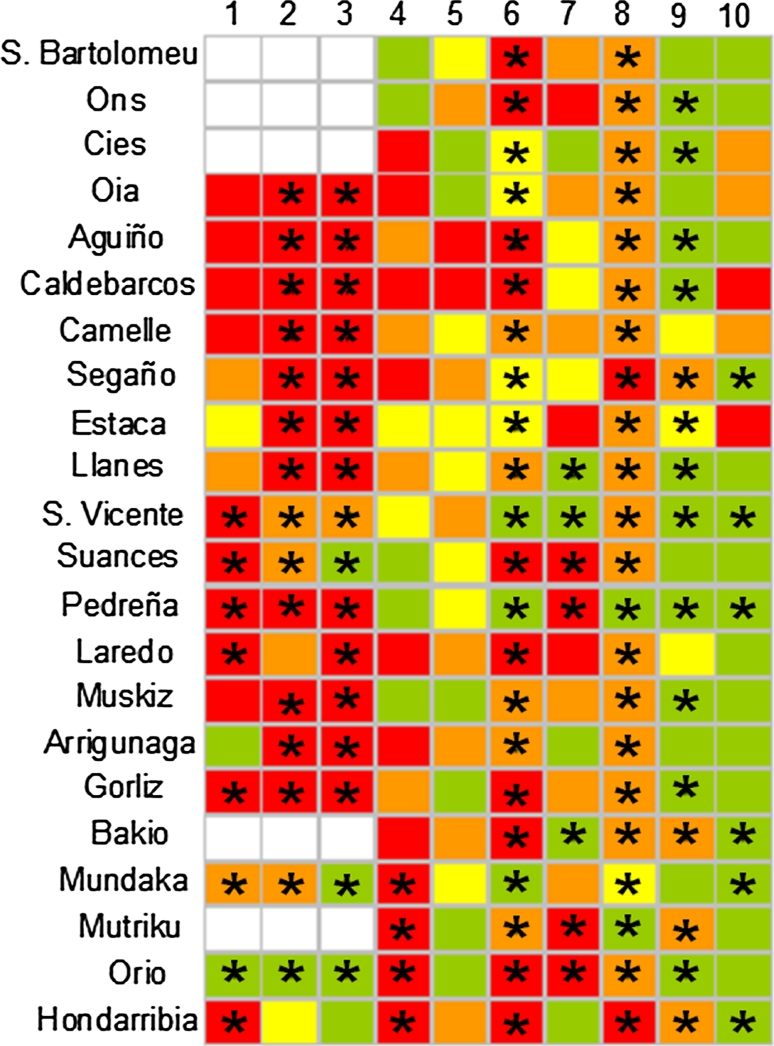
Fig. 3.
Diagrammatic representation of the Health Status Index (HSI) (White sample missing/lost, Green healthy, Yellow low stress, Orange Medium stress, Red high stress) determined by the expert system using mussels M. galloprovincialis as sentinels to monitor ecosystem health after POS in Galicia and the Bay of Biscay. Asterisks indicate exposure to organic chemical compounds, according to the exposure biomarker AOXexp. 1 April-03, 2 July-03, 3 Sept-03, 4 April-04, 5 July-04, 6 Oct-04, 7 April-05, 8 July-05, 9 Oct-05, 10 April-06

