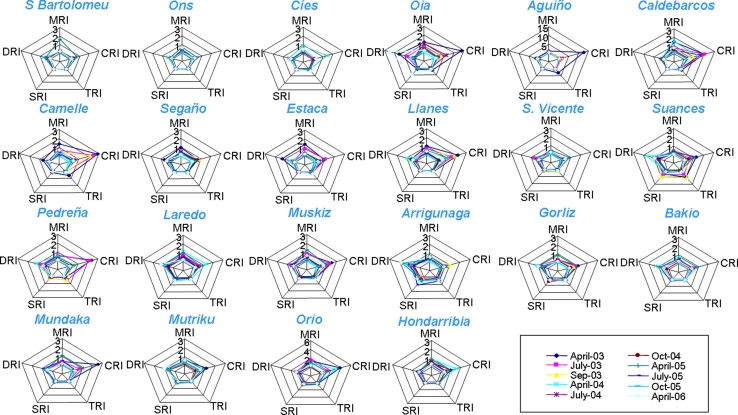
Fig. 7.
Star plots representing the responses at the five levels of biocomplexity (MRI = AOXeff, CRI = LRI, TIR = ERI, SRI = IRI and DRI = PII) used to compute the IBI that were estimated after measuring biomarkers (AOXeff, LP, VvL, VvBAS, CIIR and CIPI) in mussels from the localities studied during the biological Mussel Watch programme carried out to monitor ecosystem health after POS in Galicia and the Bay of Biscay (2003–2006). Each of the five axes of the star plots represents the relative degree of response of one biomarker. Colour lines represent different samplings (legend)

