Fig. 1.
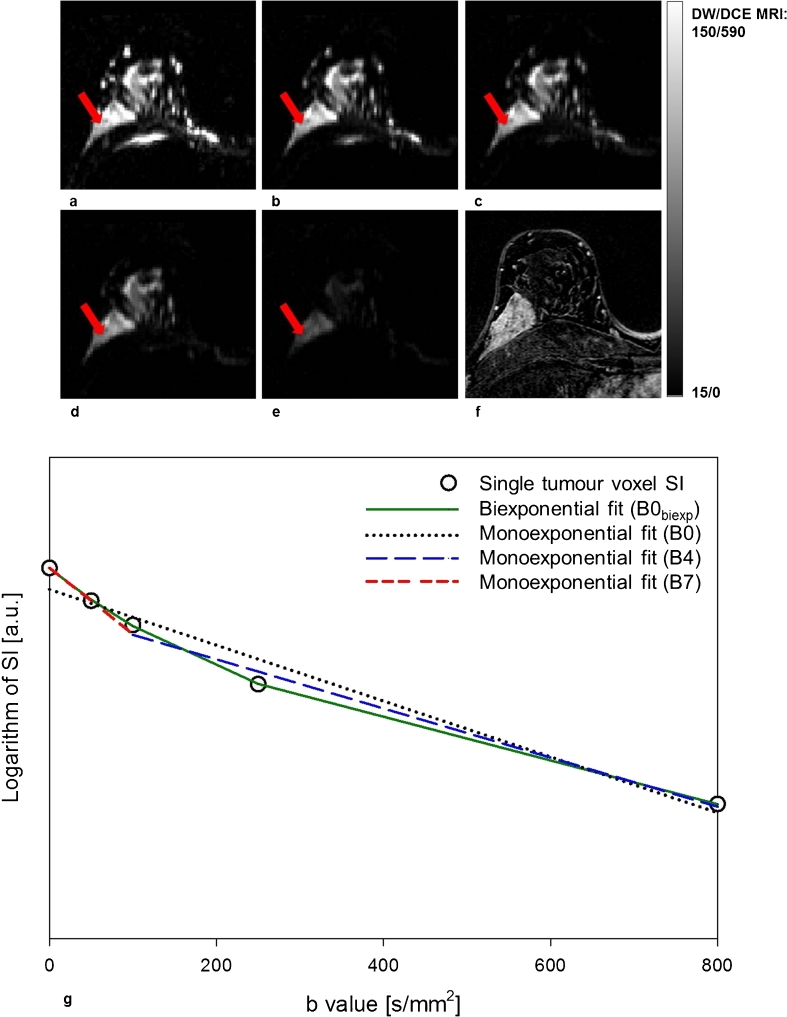
Axial diffusion-weighted images with b values 0 (a), 50 (b), 100 (c), 250 (d) and 800 s/mm2 (e) and corresponding axial contrast-enhanced T1-weighted subtraction image (DCE MRI) (f) of the right breast of a patient with invasive ductal carcinoma (grade 2). Attenuation of the DW MRI signal from a single voxel within the breast lesion (red arrow in a–e) is plotted together with the monoexponential and biexponential model fits with all b values (B0/B0biexp), b = 100, 250 and 800 s/mm2 (B4) and b = 0 and 50 s/mm2 (B7) (g)

