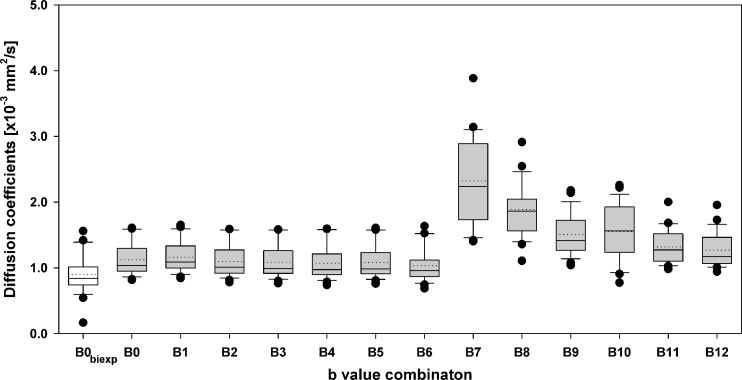
Fig. 2.
Box-plot of median individual breast lesion diffusion coefficients (first box in white) and apparent diffusion coefficients (grey boxes) calculated using respectively the biexponential model with all b values (B0biexp: b = 0, 50, 100, 250 and 800 s/mm2) and the monoexponential model with the following b value combinations: B0 (all b values), B1: b = 0 and 800 s/mm2, B2: b = 50 and 800 s/mm2, B3: b = 50, 100, 250 and 800 s/mm2, B4: b = 100, 250 and 800 s/mm2, B5: b = 100 and 800 s/mm2, B6: b = 250 and 800 s/mm2, B7: b = 0 and 50 s/mm2, B8: b = 0 and 100 s/mm2, B9: b = 0 and 250 s/mm2, B10: b = 50 and 100 s/mm2, B11: b = 50 and 250 s/mm2 and B12: b = 100 and 250 s/mm2. The horizontal solid and dotted lines within each box represents the median and the mean, respectively. The black circles represent outliers and the top and bottom of the boxes show the 95th and the 5th percentiles

