
Figure 2.
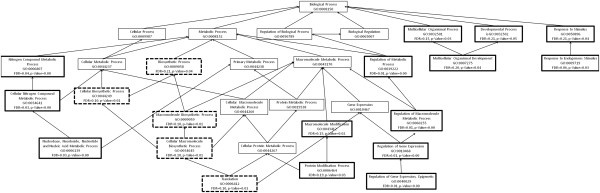
An enrichment graph of the over- and under-expressed genes in the leaves of the susceptible branch of Eucalyptus melliodora. We have used the gene ontology categories under the biological processes group. These transcripts are 10-fold differentially expressed in leaves of the resistant branch from the same tree. The boxes with a thick border indicate GO categories that are significantly different between the resistant and susceptible branches. Those with a solid outline are significantly up-regulated in the susceptible branch and those with a broken line are significantly down-regulated in the susceptible branch.