
Figure 6.
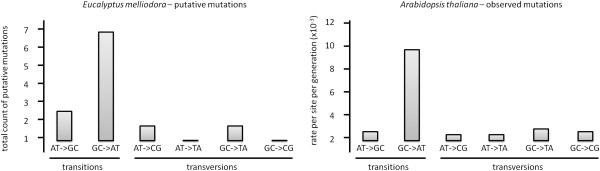
The spectrum of 10 putative mutations in E. melliodora (this study) shows striking similarities with the known spectrum of mutations from a recent mutation accumulation study in Arabidopsis thaliana [[32]]. On the x-axis we have shown the type of SNP and labelled which polymorphisms are transitions and which are transversions. The y-axis shows the mutation rate in total count of polymorphisms on the left graph (this study) and rate per site per generation on the right graph (Arabidopsis thaliana genome).