
Figure 2.
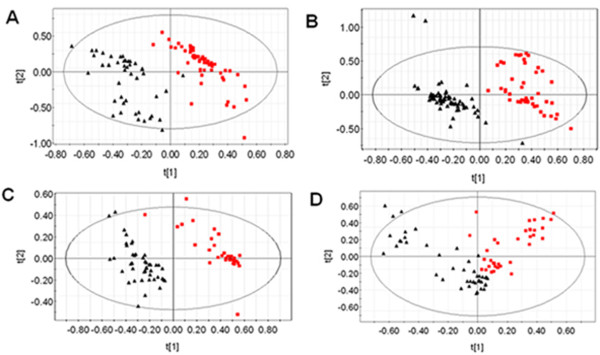
Gas chromatography/time-of-flight mass spectrometry (GC/TOF-MS) analysis. Orthogonal signal correction/partial least squares (OSC-PLS) scores plot of GC/TOF-MS data of plasma from the four phenotypes of polycystic ovary syndrome (PCOS) patients (red squares) and the controls (black triangles). (A) PCOS patients with hyperandrogenism (HA), anovulation (AO) and polycystic ovaries (PCO) (HA+AO+PCO) vs controls; (B) PCOS patients (AO+PCO) vs controls; (C) PCOS patients (HA+AO) vs controls; (D) PCOS patients (HA+PCO) vs controls.